# WorldPopPy README *A Python client for downloading, merging, and processing WorldPop raster data.* **WorldPopPy** provides a programmatic interface to the [WorldPop](https://www.worldpop.org/) open data archive. WorldPop offers global, gridded datasets on population dynamics, night-light emissions, topography, and much more. These datasets are typically distributed as individual files per country. **WorldPopPy** abstracts the process of data discovery, retrieval, and preprocessing. Users query data by Area of Interest (AOI). The library automatically identifies the necessary country rasters, downloads them, and merges them into a unified dataset. (See the [Example Gallery](#example-gallery) below for a visual overview of the library's capabilities). ## Key Features * Fetch data for any region by passing GeoDataFrames, country codes, or bounding boxes. * Easy handling of time-series through integration with [`xarray`](https://docs.xarray.dev/en/stable/). * Built-in optimisations to help you handle massive country rasters. * Parallel data downloads with automatic retry logic, local caching, and dry-run support. * Searchable data manifest, allowing you to quickly find WorldPop products of interest. ## Installation ```bash pip install worldpoppy ``` ## Quickstart ### Example 1: Merging Population Rasters for Several Countries ```python import matplotlib.pyplot as plt from matplotlib.colors import LogNorm from worldpoppy import wp_raster, clean_axes, plot_country_borders # Fetch & Merge Data # `wp_raster` returns an xarray.DataArray ready for analysis and plotting. countries = ['THA', 'KHM', 'LAO', 'VNM'] pop_data = wp_raster( product_name='pop_g2_1km_r25a', # Low-res. pop. estimates (Global 2 series) aoi=countries, years=2024 ) # Plot (Log-scale) # We use fillna(0) to represent areas without population and +1 to avoid log(0). (pop_data.fillna(0) + 1).plot(norm=LogNorm(), cmap='inferno', size=6) plot_country_borders(countries, edgecolor='white', linewidth=0.5) clean_axes(title=f"Lower Mekong Region (2024):\n{pop_data.sum() / 1e6:.1f}M People") plt.show() ``` Population in the Lower Mekong Region, 2024 ### Example 2: Built-in Support for Time-series ```python import matplotlib.pyplot as plt from matplotlib.colors import LogNorm from worldpoppy import wp_raster, bbox_from_location, clean_axes # 
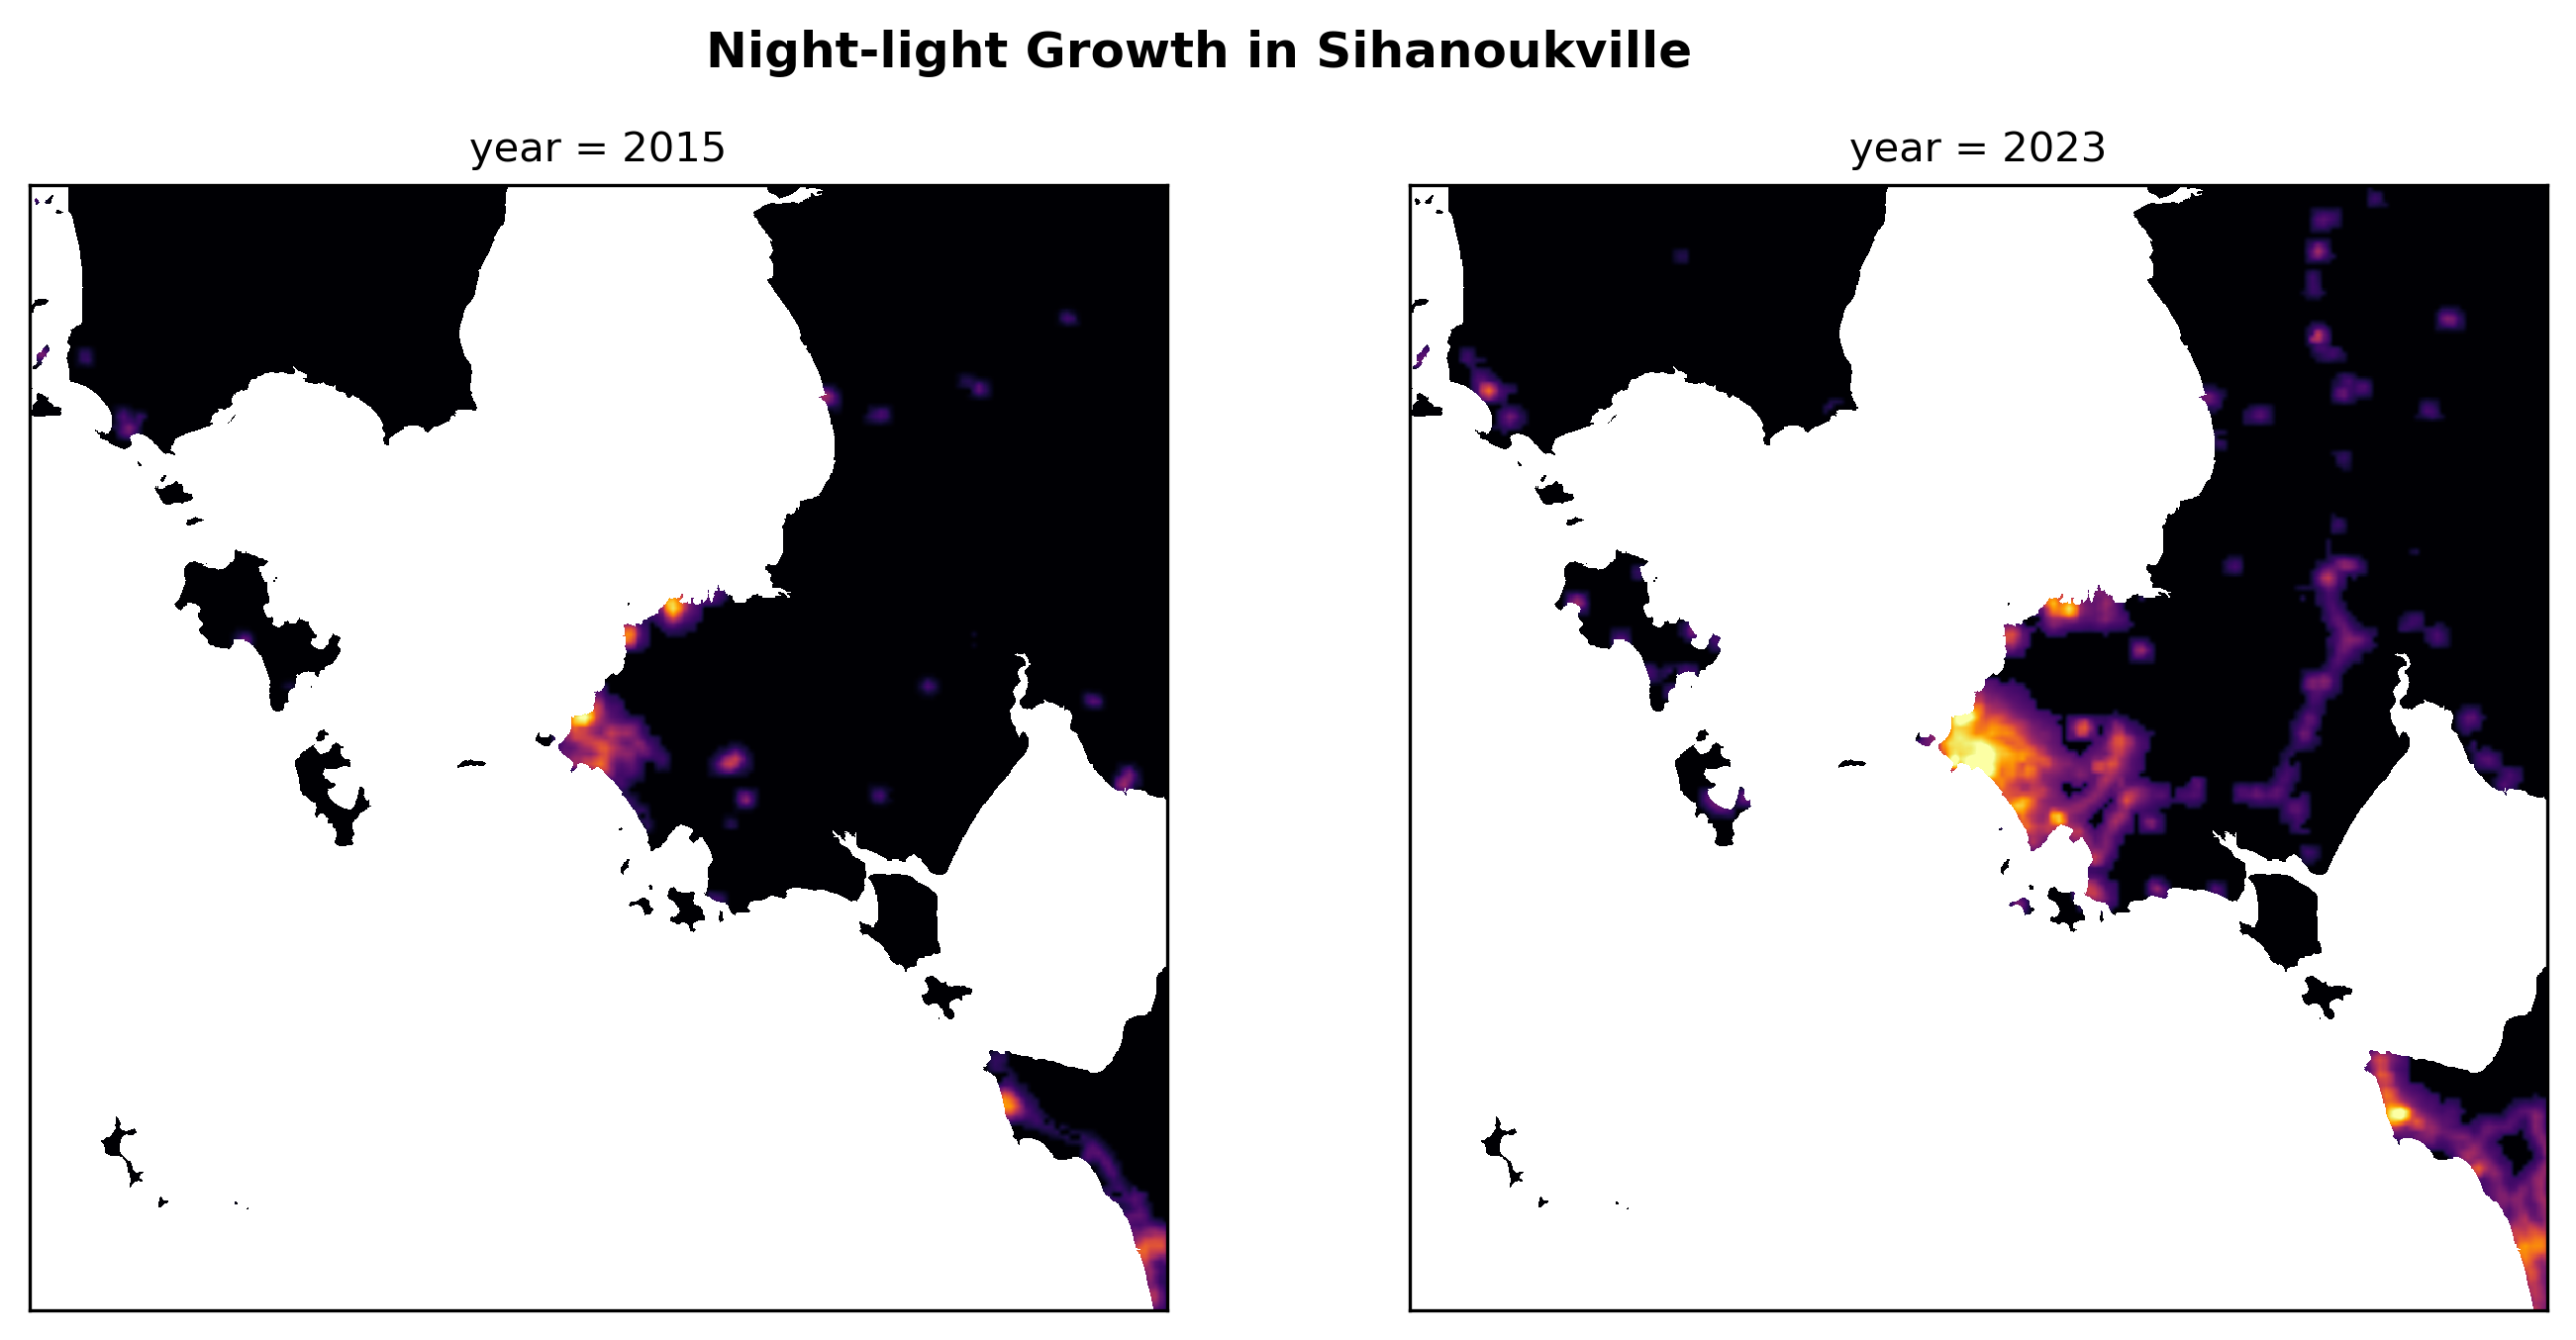
Fetch Two Years of Night-light Data for Sihanoukville (Cambodia) ntl_data = wp_raster( product_name="ntl_viirs_g2", aoi=bbox_from_location("Preah Sihanouk", width_km=100), years=['first', 'last'] # Request first & last available year ) # Plot: Xarray can create a facet grid by year p = (ntl_data + 1).plot( col="year", figsize=(10, 5), cmap="inferno", vmax=50, norm=LogNorm(), add_colorbar=False # Remove since radiance units are not intuitive ) p.fig.suptitle('Night-light Growth in Sihanoukville', fontsize=12, fontweight='bold') p.fig.subplots_adjust(top=0.875) clean_axes(p) plt.show() ``` Night lights in Sihanoukville, 2015-2023 ## Finding Data Use `show_supported_data_products` for a quick overview of what is supported by **WorldPopPy**: ```python from worldpoppy import show_supported_data_products # Print data products related to "population" from the Global 2 series show_supported_data_products(keywords=["population", "global2"]) # Print static (single-year) data products available for Brazil show_supported_data_products(static_only=True, iso3_codes="BRA") ``` Alternatively, you can also get the library's full data manifest as a pandas DataFrame: ```python from worldpoppy import wp_manifest mdf = wp_manifest() mdf.head() ``` ## Documentation * **API Reference:** https://worldpoppy.readthedocs.io/ * **Examples:** See the [`examples/`](https://github.com/lungoruscello/WorldPopPy/blob/master/examples/) folder in this repository. ## Example Gallery

1. Visualising Night Lights

Korea Night Lights

The Korean Peninsula
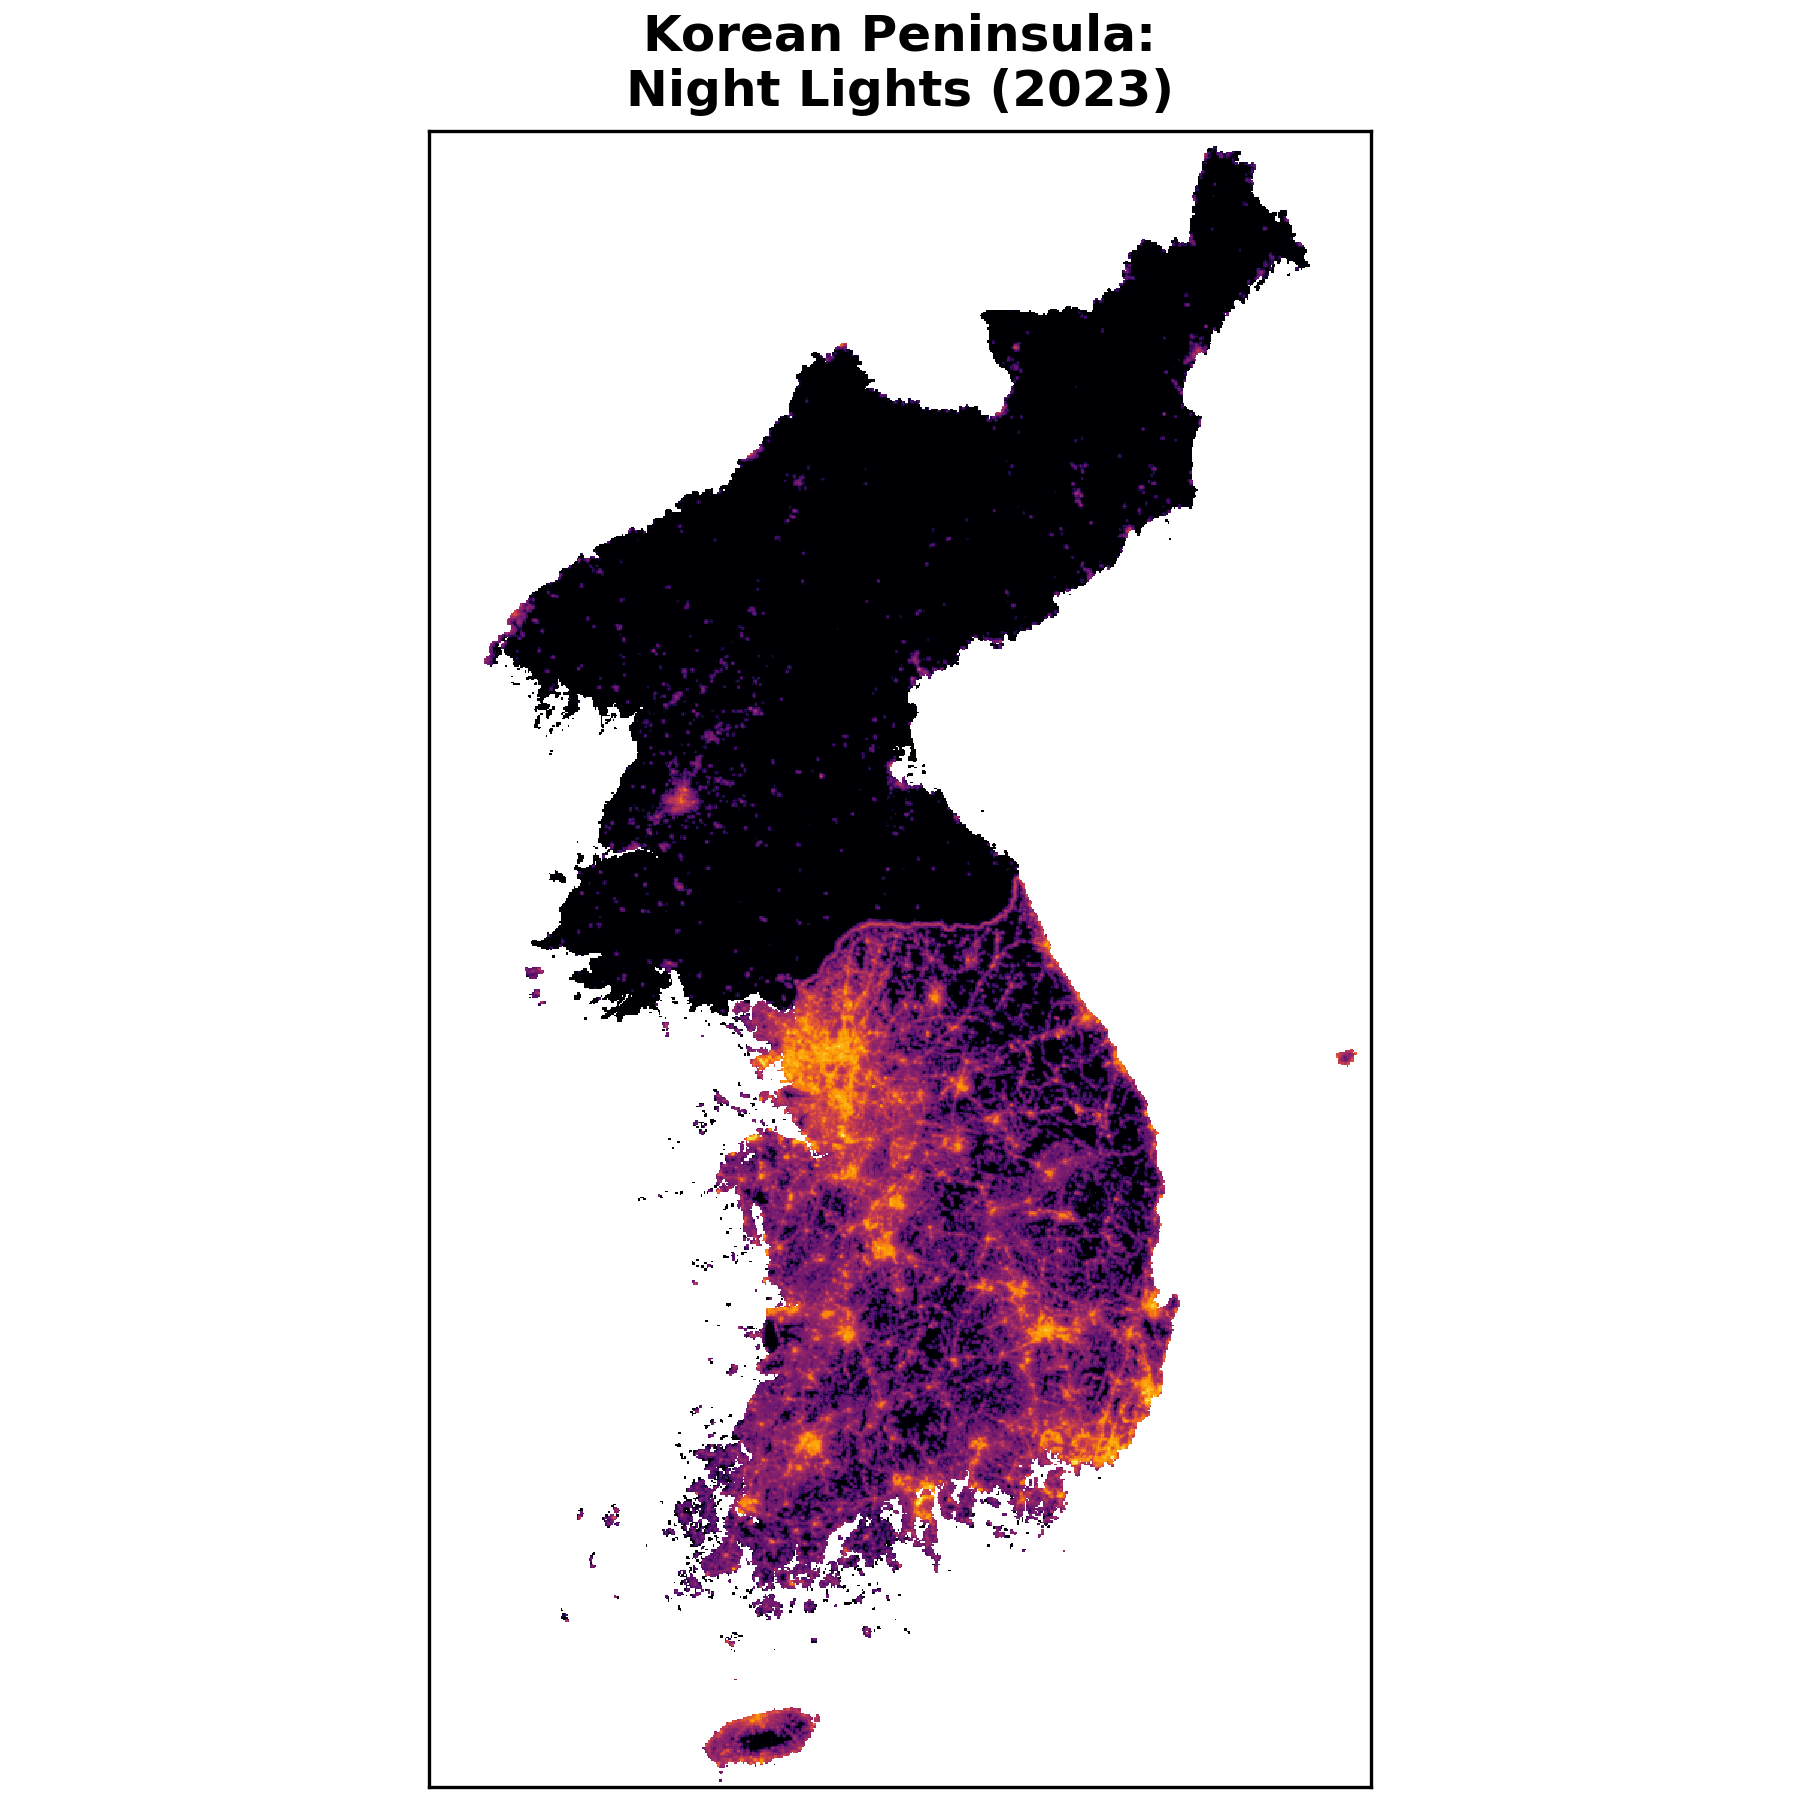
Quickly fetch, merge, and reproject night-light data for North and South Korea.

2. Analysing Population Growth

West Africa Growth

The Abidjan-Lagos Corridor
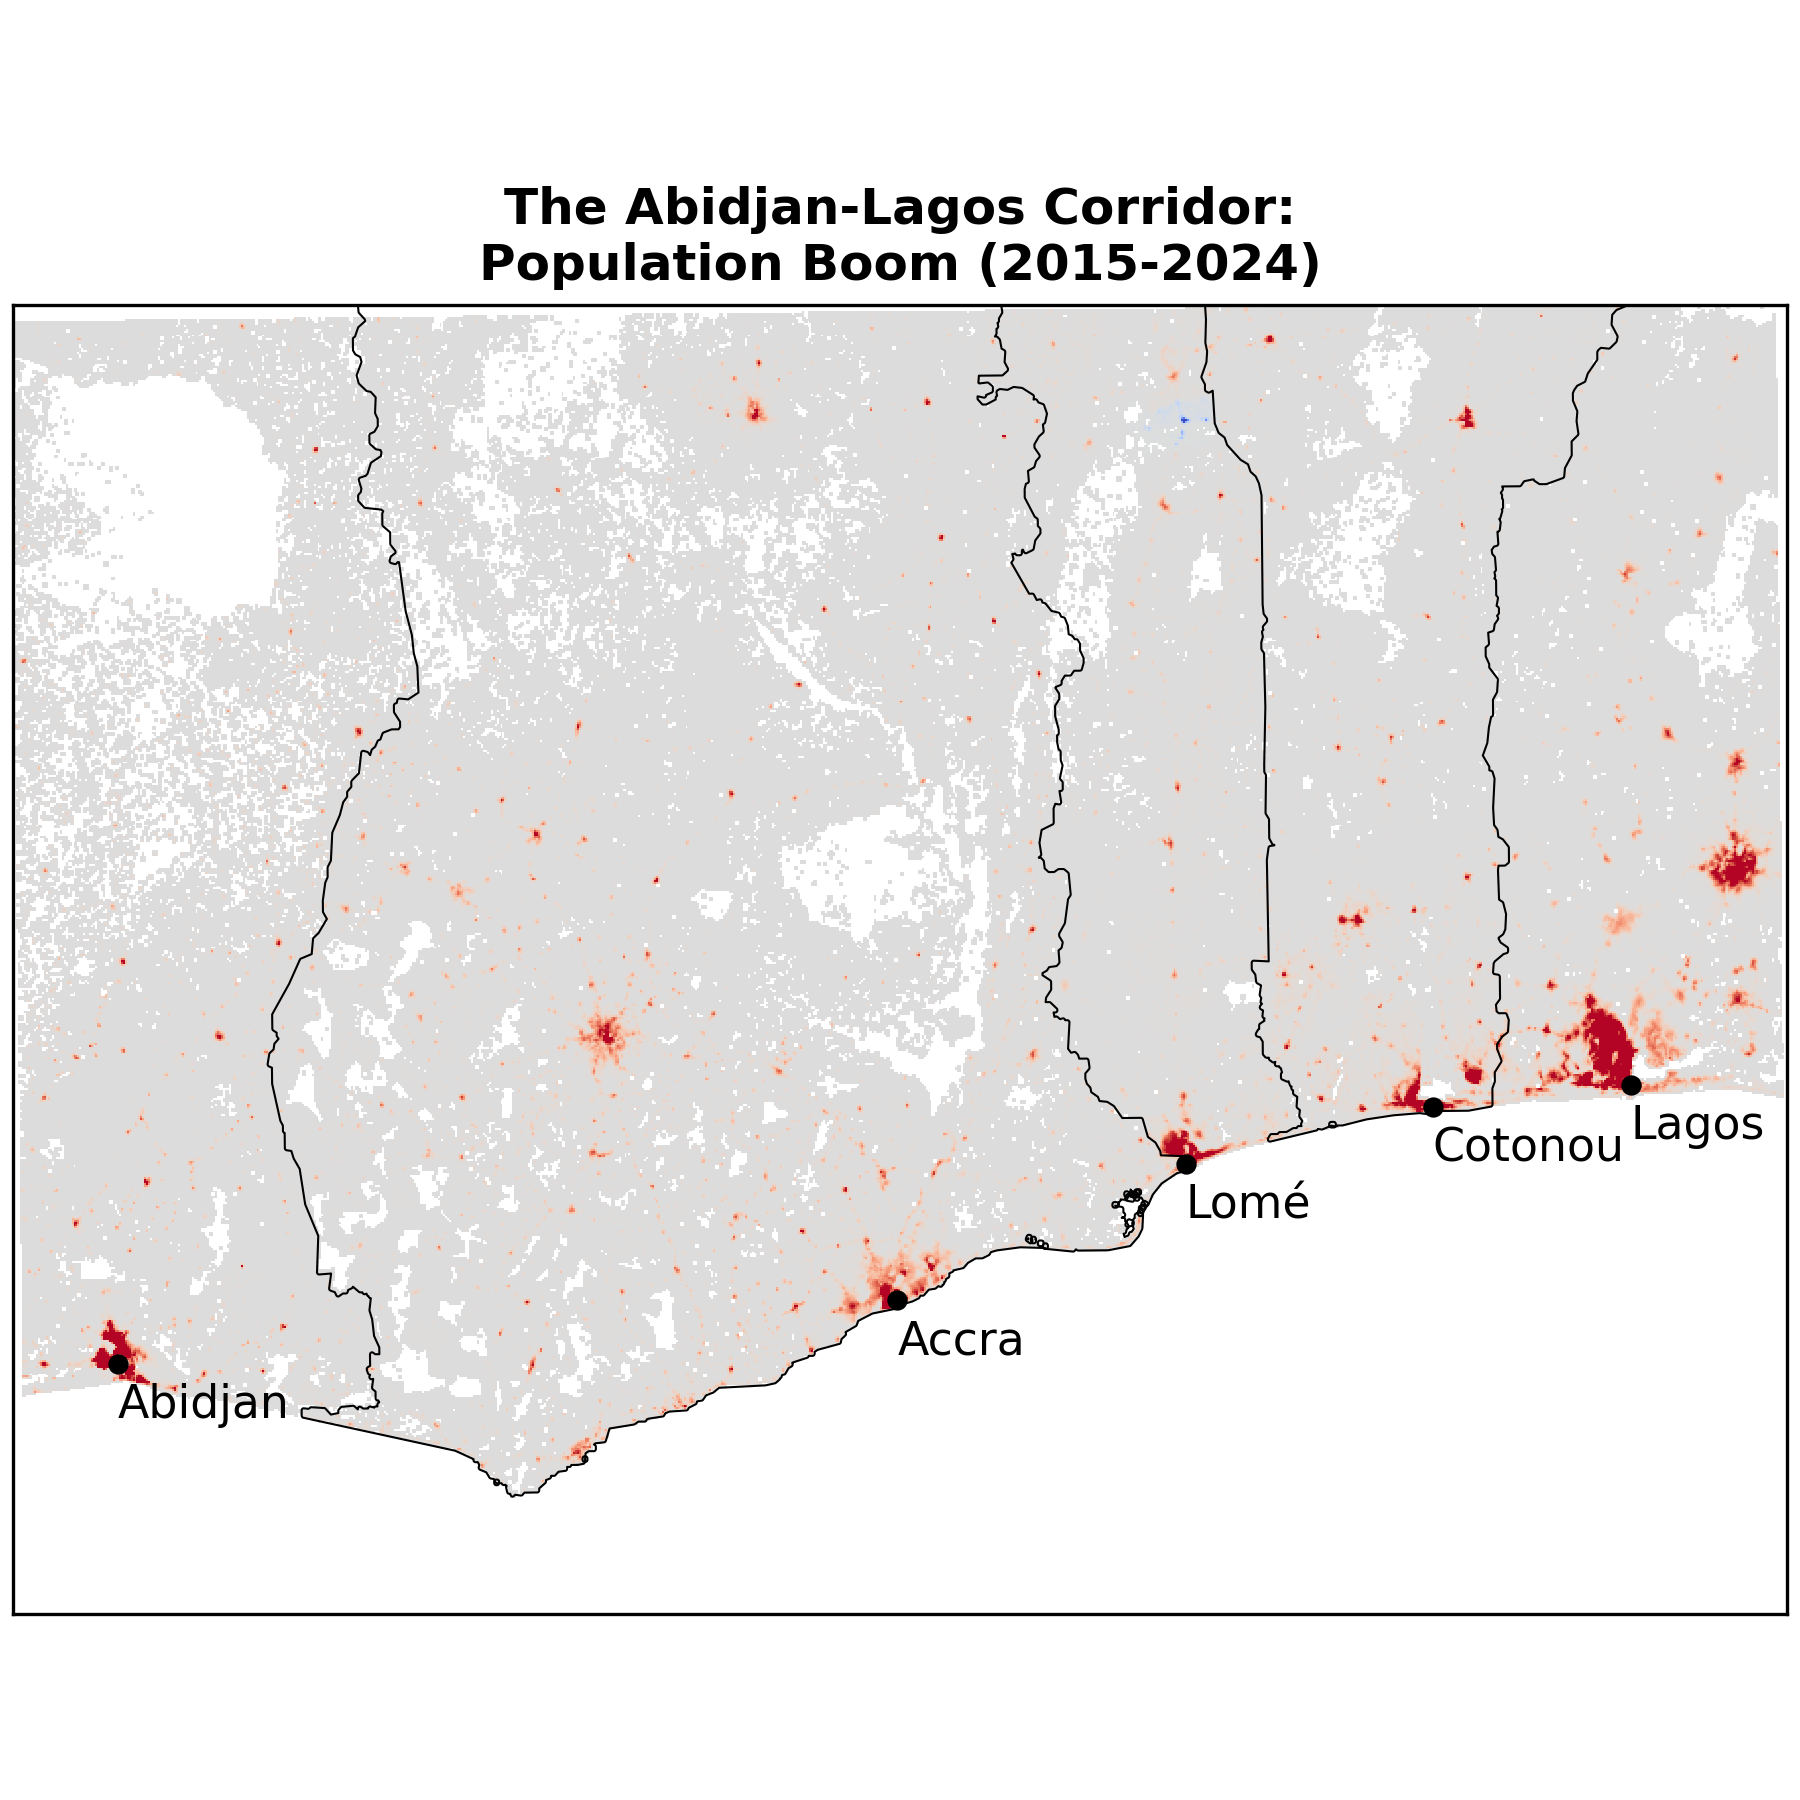
Visualise 10-year population change along the coast of West Africa.

3. Automatic Memory Optimisation

Kamchatka Topo

Southern Kamchatka
Handle large source rasters (2GB+) efficiently via automatic spatial subsetting.

4. Manual Memory Optimisation

Chile Weather

Mainland Chile
Easily clip country geometries and lazy-load rasters with Dask.
## Utilities **WorldPopPy** includes helper functions to manage the local cache and download bandwidth. ### 1. Managing the Cache Downloaded rasters are cached locally by default. You can change the location by setting the `WORLDPOPPY_CACHE_DIR` environment variable. ```python from worldpoppy import purge_cache, get_cache_dir # Print the cache directory print(get_cache_dir()) # Check local cache size purge_cache(dry_run=True) # Delete all cached files purge_cache(dry_run=False) ``` ### 2. Download Dry Run To estimate the size of a request before downloading, use the `download_dry_run` flag: ```python from worldpoppy import wp_raster # Prints a summary of files to be downloaded without fetching them wp_raster( product_name='pop_g1', aoi=['CAN', 'USA'], years='all', download_dry_run=True ) ``` ## Data Usage & Attribution **WorldPopPy** is a client for accessing data; it does not host or own the data. Please note the following points regarding data provenance and citation: 1. **Curated "Product Names"**: To simplify data discovery, this library organises WorldPop's thousands of raw files into curated "Data Products" with a consistent naming scheme (e.g., `pop_g1_alt` or `pop_g2_alt`). These product names are specific to **WorldPopPy**. 2. **Know Your Data:** While this library makes downloading and pre-processing easy, we strongly encourage you to understand what you are downloading. WorldPop datasets are often the result of complex modelling. Always check the `summary_url` provided in the manifest for details and further notes. ```python from worldpoppy import wp_manifest # Select country entries for one "product" using its curated WorldPopPy alias mdf = wp_manifest(product_name='pop_g2_alt', iso3_codes='AFG') # Inspect the raw metadata for one raster file (sourced from the WorldPop API) row = mdf.iloc[0] print(f"Source File Name: {row.dataset_name}") print(f"Official Dataset Title: {row.api_entry_title}") print(f"Official Data Category: {row.api_series_category}") print(f"Dataset Summary: {row.summary_url}") # Read this before using data! print("-----") # > The internal fields below are for data discovery in WorldPopPy print(f"Library Product Name: {row.product_name}") print(f"Multi-year Product? {row.multi_year}") print(f"Library Product Notes: {row.product_notes}") ``` 3. **Cite the Source:** If you use this data, please cite its original creators ([WorldPop](https://www.worldpop.org/)). The scientific credit belongs to them. Note that the recommended citation style can differ between datasets, so be sure to check the `summary_url` for details. ## Acknowledgements **WorldPopPy** is inspired by the World Bank's [BlackMarblePy](https://github.com/worldbank/blackmarblepy/tree/main) package, which provided the blueprint for this library's download module and informed the API design. ## Licence This project is licensed under the [Mozilla Public License](https://www.mozilla.org/en-US/MPL/2.0/). See [LICENSE.txt](https://github.com/lungoruscello/WorldPopPy/blob/master/LICENSE.txt) for details.